Statistical Tools Used in Continued Process Verification (CPV)
A robust Continued Process Verification (CPV) program relies heavily on statistical methods to identify trends, monitor variability, and detect process shifts before they affect product quality. Modern pharmaceutical manufacturers utilize statistical software and data visualization tools to evaluate process performance in real time.
1. Statistical Process Control (SPC)
Statistical Process Control (SPC) is one of the most widely used methodologies in CPV. It involves the continuous monitoring of process data to determine whether a manufacturing process remains in a state of statistical control.
SPC helps manufacturers to:
- Identify special cause variation
- Monitor process consistency
- Reduce process variability
- Improve manufacturing efficiency
- Prevent batch failures
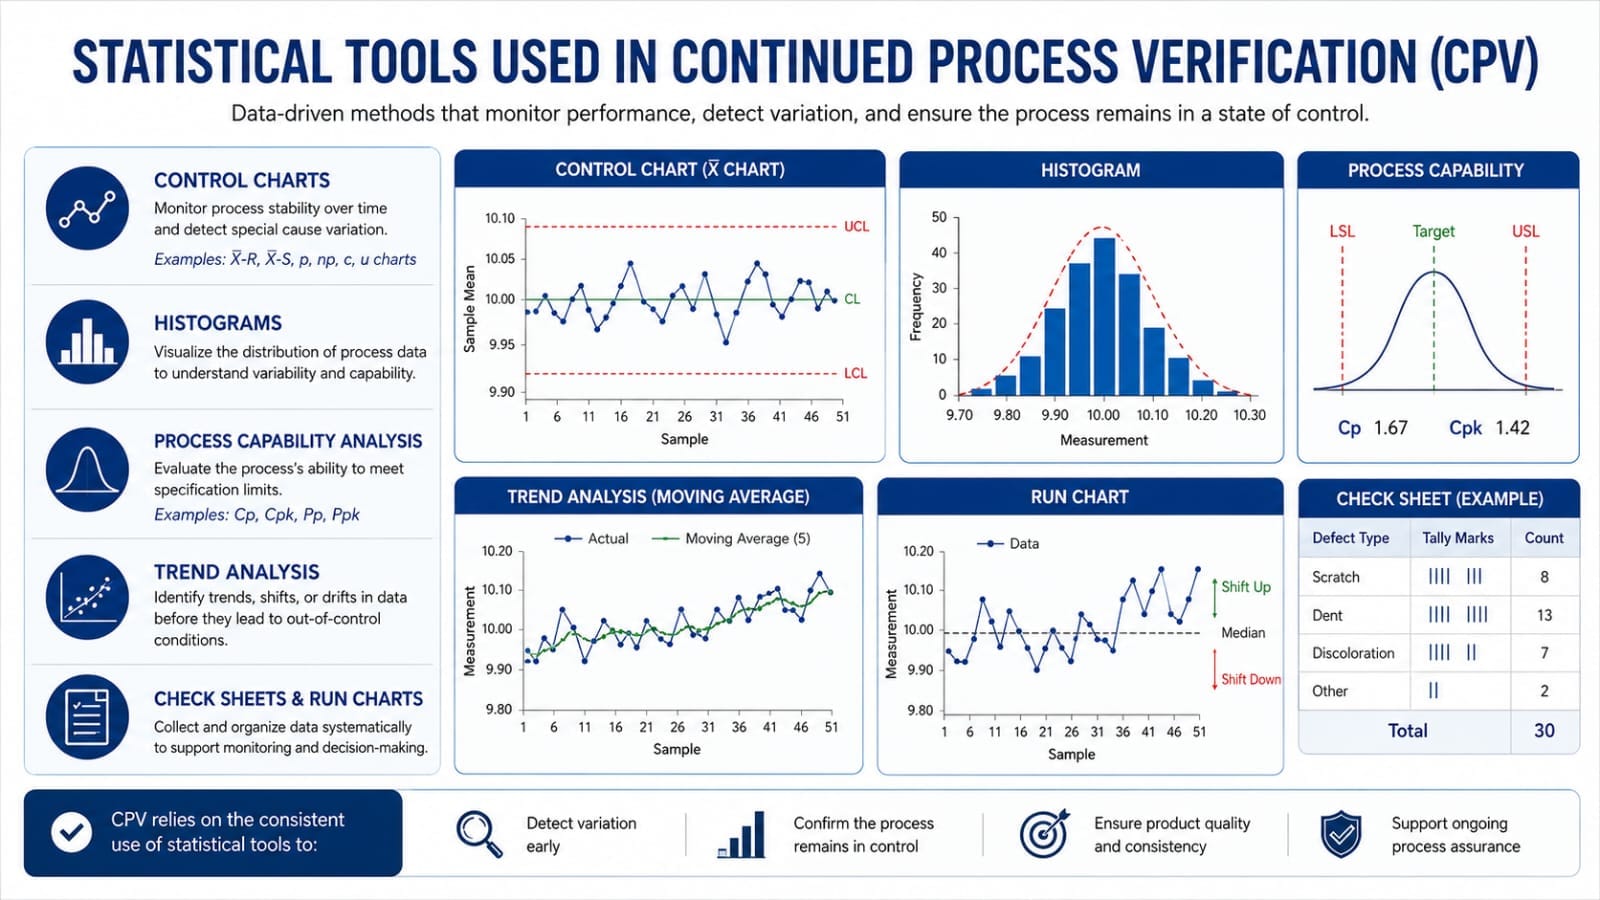
2. Control Charts
Control charts provide a graphical representation of process performance over time. They help distinguish between normal process variation and unusual events that require investigation.
Common control charts include:
- X-Bar Chart
- R Chart
- S Chart
- Individuals (I-MR) Chart
- p-Chart
- c-Chart
Control charts typically include:
- Center Line (Process Average)
- Upper Control Limit (UCL)
- Lower Control Limit (LCL)
- Individual Data Points
Any data point outside the control limits or exhibiting non-random patterns should trigger an evaluation according to the site’s CPV procedure.
3. Process Capability Analysis
Process capability measures how well a manufacturing process consistently produces results within established specification limits.
The most commonly used indices include:
- Cp – Potential process capability
- Cpk – Actual process capability considering process centering
- Pp – Overall process performance
- Ppk – Long-term process performance
Higher capability indices indicate a more capable and consistent manufacturing process. Companies often establish internal acceptance criteria based on product criticality and process maturity.
4. Trend Analysis
Trend analysis is an essential component of CPV. Even when all batches meet specifications, gradual shifts in process performance may indicate process drift.
Trend analysis may identify:
- Increasing assay variability
- Gradual decline in dissolution performance
- Compression force drift
- Tablet weight variation
- Coating thickness changes
- Yield reduction
Early detection enables preventive actions before deviations or Out-of-Specification (OOS) results occur.
5. Pareto Analysis
Pareto charts help identify the most significant contributors to deviations, defects, complaints, or process failures. Applying the 80/20 principle allows organizations to prioritize improvement efforts on issues that have the greatest impact on product quality.
6. Regression Analysis
Regression analysis evaluates relationships between process parameters and quality attributes. It helps determine whether changes in one variable significantly influence another and supports process understanding and optimization.
Key Performance Indicators (KPIs) for CPV
Organizations should define measurable KPIs to assess the effectiveness of their Continued Process Verification program. Typical indicators include:
- Batch rejection rate
- Process capability (Cp/Cpk)
- Yield percentage
- Deviation frequency
- Out-of-Specification (OOS) rate
- Out-of-Trend (OOT) occurrences
- Customer complaints
- Equipment downtime
- Process cycle time
- Right First Time (RFT)
- CAPA effectiveness
- Annual Product Quality Review (APQR/PQR) trends
Sources of Data for Continued Process Verification
CPV integrates information from multiple systems across the pharmaceutical quality management framework. Data sources commonly include:
- Batch Manufacturing Records (BMRs)
- Electronic Batch Records (EBRs)
- Laboratory Information Management Systems (LIMS)
- Manufacturing Execution Systems (MES)
- Equipment monitoring systems
- Environmental monitoring data
- Cleaning validation results
- Calibration records
- Preventive maintenance records
- Deviation investigations
- CAPA records
- Customer complaints
- Stability study data
- Supplier quality metrics
Implementing a Continued Process Verification Program
Implementation of CPV should follow a structured and risk-based approach integrated into the Pharmaceutical Quality System (PQS).
Step 1: Define Critical Parameters
Identify Critical Quality Attributes (CQAs), Critical Process Parameters (CPPs), and Critical Material Attributes (CMAs) through process development, risk assessments, and historical manufacturing knowledge.
Step 2: Establish Monitoring Plans
Develop written procedures describing:
- Parameters to monitor
- Sampling frequency
- Data collection methods
- Statistical techniques
- Responsibilities
- Escalation criteria
Step 3: Collect Process Data
Collect manufacturing and quality data from every commercial batch or at predefined frequencies, ensuring data integrity in accordance with ALCOA+ principles.
Step 4: Analyze the Data
Use validated statistical software or approved analytical tools to evaluate process stability, identify trends, and calculate capability indices. Data should be reviewed by qualified personnel and documented appropriately.
Step 5: Investigate Abnormal Trends
Unexpected variability, recurring shifts, or statistically significant trends should be investigated promptly. Root cause analysis tools such as Fishbone Diagrams, 5 Whys, or Failure Mode and Effects Analysis (FMEA) may be applied to determine contributing factors.
Step 6: Implement Corrective and Preventive Actions (CAPA)
Where investigations identify assignable causes, suitable CAPAs should be implemented, verified for effectiveness, and monitored to ensure sustained process improvement.
Step 7: Perform Periodic Management Review
Senior management should periodically review CPV outcomes, process performance metrics, and improvement opportunities as part of the Pharmaceutical Quality System. Findings should also support Annual Product Quality Reviews (APQR/PQR) and ongoing lifecycle management.
Establishing Alert and Action Limits
A mature CPV program defines statistical thresholds to support proactive decision-making.
- Alert Limits: Indicate potential process drift requiring increased monitoring or evaluation.
- Action Limits: Indicate significant deviation from expected performance and require formal investigation and documented actions.
These limits should be scientifically justified using historical process data, process capability studies, and quality risk management principles rather than relying solely on product specification limits.
Using CPV Dashboards
Many pharmaceutical companies use digital dashboards to visualize process performance and facilitate timely decision-making. A typical CPV dashboard may display:
- Control charts for CPPs and CQAs
- Batch yield trends
- Cp/Cpk and Pp/Ppk values
- Deviation and CAPA metrics
- OOS and OOT trends
- Equipment performance indicators
- Environmental monitoring summaries
- Stability data trends
Interactive dashboards enable quality, manufacturing, engineering, and regulatory teams to collaboratively monitor process health and identify opportunities for continual improvement.
To be continued in Part 3…
Regulatory Disclaimer: This article is intended solely for educational and informational purposes. It summarizes industry practices and publicly available regulatory concepts related to Continued Process Verification (CPV). Readers should always refer to the latest applicable regulations, guidance documents, pharmacopeial requirements, and internal quality procedures before implementing any regulatory or manufacturing decisions.